Great Ruaha River — ZFO Forecast Bulletin 2
Status: Elevated — Monitoring active (A1 Detected)
A1 anchor: None
A1 regression: ~17 Oct 2026. (rolling_df.iloc[-1][“forecast_median”])
Rainfall analog: upper bound (contextual guidance only)
Operational interpretation
- Operational status is determined from measured satellite observations, not forecasts.
- Forecast confidence increases as additional Sentinel-2 observations accumulate each season.
- The rainfall analog provides contextual guidance rather than a primary predictor — storage dynamics can override seasonal rainfall totals.
- The integrated forecast combines complementary evidence streams rather than averaging independent models.
- The A1-anchor forecast activates only once Alert 1 is confirmed crossed (R²=0.757 historically) — it is currently the strongest single predictor.
Active monitoring
OBSERVED (gee) Pipeline not yet
·
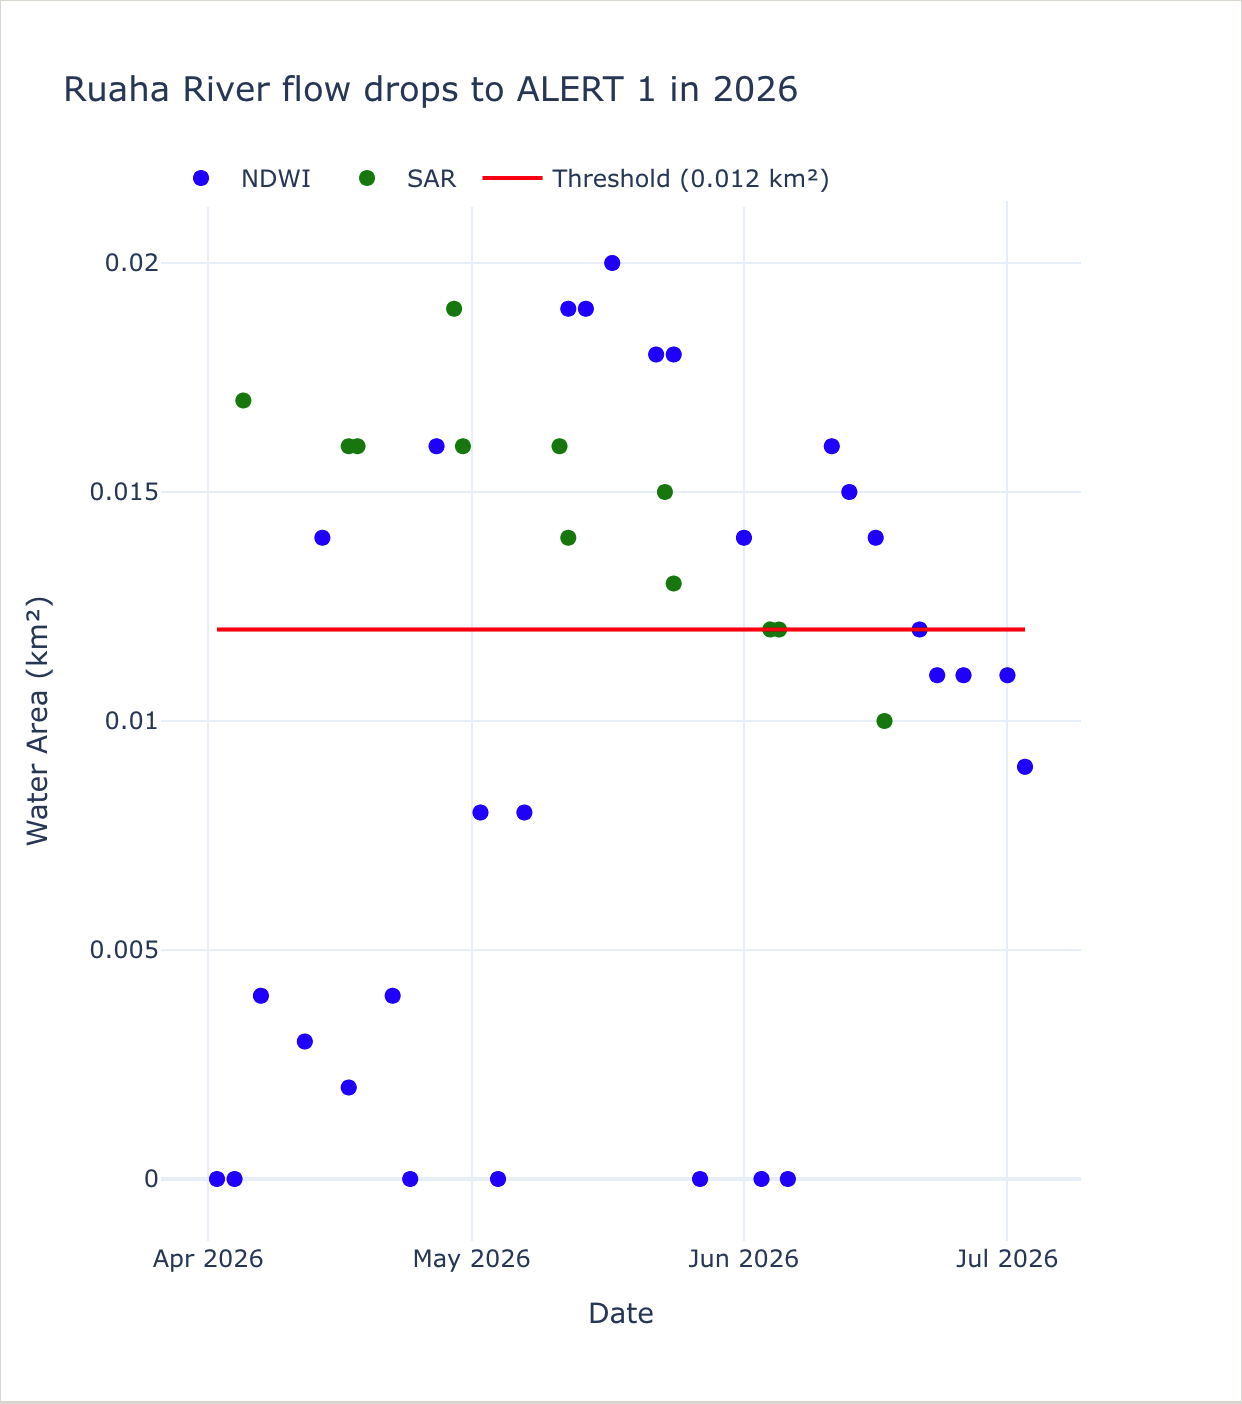
0.0155 km² (pipeline threshold 0.010 km²)
Downstream alerts and field team notified · SAR-SR script confirmed approaching threshold.
Expected ~23 July (gee)
Pipeline FORECAST
·
±15 days uncertainty
mean lead ~50 days to ZFO (historical, R²=0.856) ·
A1 anchor inactive until A1 detection
Mean lead time to ZFO once A2 detected: ~60 days
Not yet
APPROXIMATE
Once confirmed: ~3 to 7 weeks lead to ZFO at Msembe Bridge
Forecast: 17 Oct
ENSEMBLE MEDIAN
·
window: 21 Aug – 20 Nov 2026
Historical RMSE: ±15 days · Observed ZFO: pending field confirmation at Msembe Bridge
Not yet
HISTORICAL
·
related to accumulated rains source area Ruaha or Park
Confirmation: Msembe Bridge field observation · confirmed by downstream waterfront advance (outflow Park)
Median
Rainfall analog
— Today
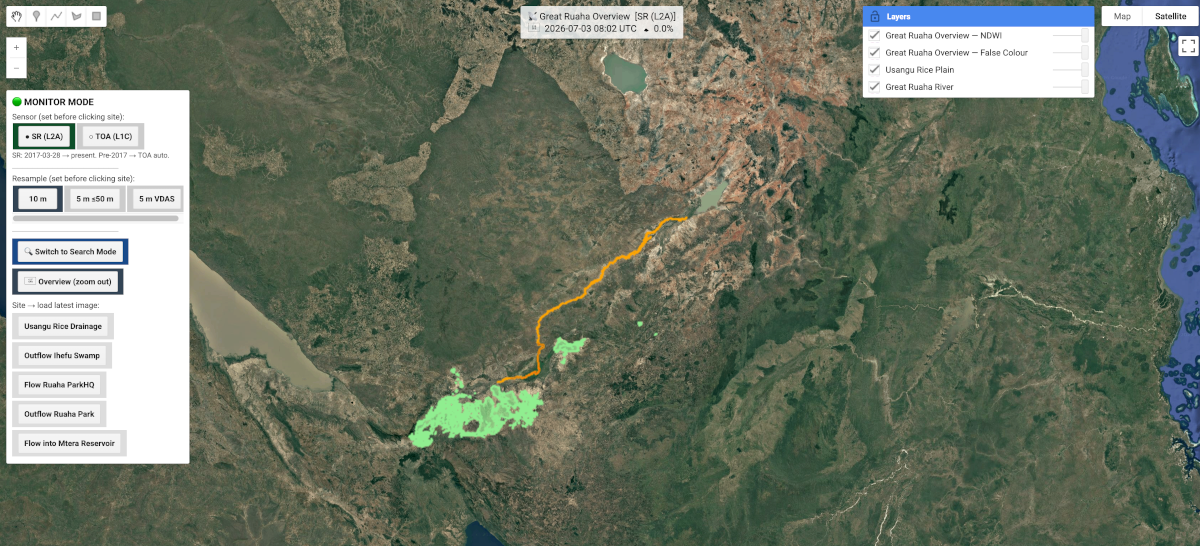
As of 7 Jul 2026, satellite tracking indicates that the Alert 1 water area has dropped to 0.0155 km², actively declining towards the 0.010 km² threshold at a decay rate of −0.00060 km²/slot. Given the current sub-seasonal storage dynamics and structural tracking, the pipeline ensemble converges on a median Zero Flow Onset (ZFO) date of 17 Oct 2026 at Msembe Bridge, within a window bounded between 21 Aug and 14 Nov 2026. S2 historical analog comparisons suggest top alignment with structural dry-down conditions witnessed across 2022, 2023, and 2021.
A1 monitoring window active. Water area at 0.0155 km² is approaching key thresholds. Issue tracking logs to downstream users and Nyaluhanga monitoring team.
Conduct A3 field visit to Nyaluhanga crossing. Record waterline position relative to branch canal mouth (remote sensing). Pixel based evaluation water vs no-water, forecast based on historic data still limited succes at this location.
Next satellite window: 11 Jul 2026. Confirm A1 (pipeline forecast) and A2 status at Mtera virtual station (current area: 0.0368 km²). Update ensemble with new water-area observation.
Updated bulletin due 21 Aug 2026. Initiate monitor New NAFCO abstraction Mbarali River.
| 05 Jul 2026 | Monitoring metrics logged. A1 trend remains active. ELEVATED |
The rainfall regression model uses upstream mountain catchment rainfall accumulations (September–May) to predict Alert 1 crossing dates from 2018–2025 historical records. Historical RMSE is approximately ±15 days. Run A fires in early May; Run B at end of June once the full pre-dry-season rainfall is known.
The satellite water-area analog matches the 2026 daily river water-area trajectory — measured from 5 m resolution false-colour Sentinel-2 imagery — against eight historical dry seasons (2018–2025, excluding 2020 which had no ZFO). Analogs are weighted by similarity in Alert 1 and Alert 2 water area. Alert 2 slope is excluded from the distance metric after testing showed no predictive power. Historical lead time varies from 62 to 128 days before ZFO.
The A1-anchor forecast uses the date of Alert 1 threshold crossing as its primary predictor (R²=0.757, p=0.011 on 2018–2025 data). It activates only once A1 is confirmed crossed. It is currently the strongest single predictor in the dataset.
The ensemble combines the three satellite-based methods. The rainfall analog is treated as an upper bound when the satellite trajectory closely matches a year that produced early ZFO despite near-normal rainfall, indicating sub-seasonal storage dynamics dominated over seasonal rainfall totals.