Flow Returns December 23, 2025 at Park HQ (Msembe)
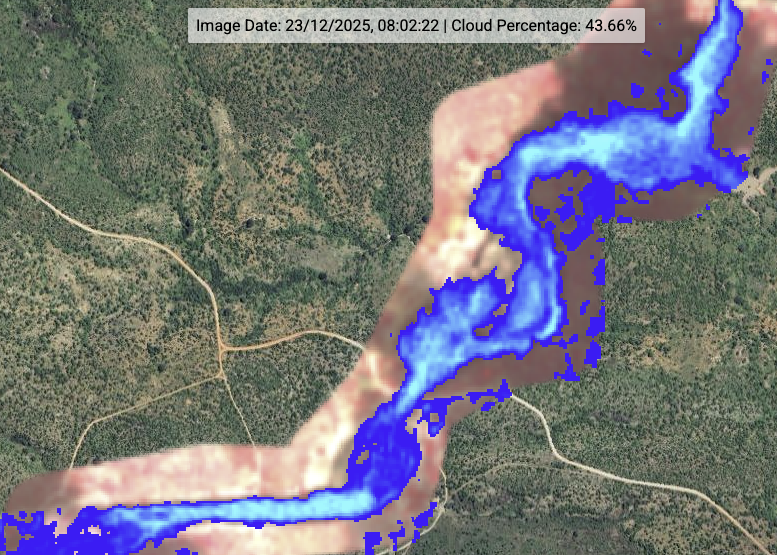
On December 23, 2025 the Ruaha River flows again at the msembe bridge (Park HQ). Downstream of the Msembe Bridge some 25km as the bird flies the Ruaha River is still dry. The earth engine interactive map (above) shows the stages from zero flow at the msembe bridge (December 18, 2025) to arrival of the flow at Msembe on December 23, 2025. And the progress of the Ruaha River flow on January 2, 2026, just 10km from the Mtera alert2 virtual station as you can check with the “Flow into Mtera Reservoir” button.
The relation between the rains and the return of flow and the origin of the rains is provided by the daily and monthly rain charts and table for the Ruaha River catchment at Msembe and two sub catchments of importance (upper ruaha (Salimwani) and Ruaha Park sub-catchments.
Two Methods to detect Zero Flow at Park HQ (Msembe)
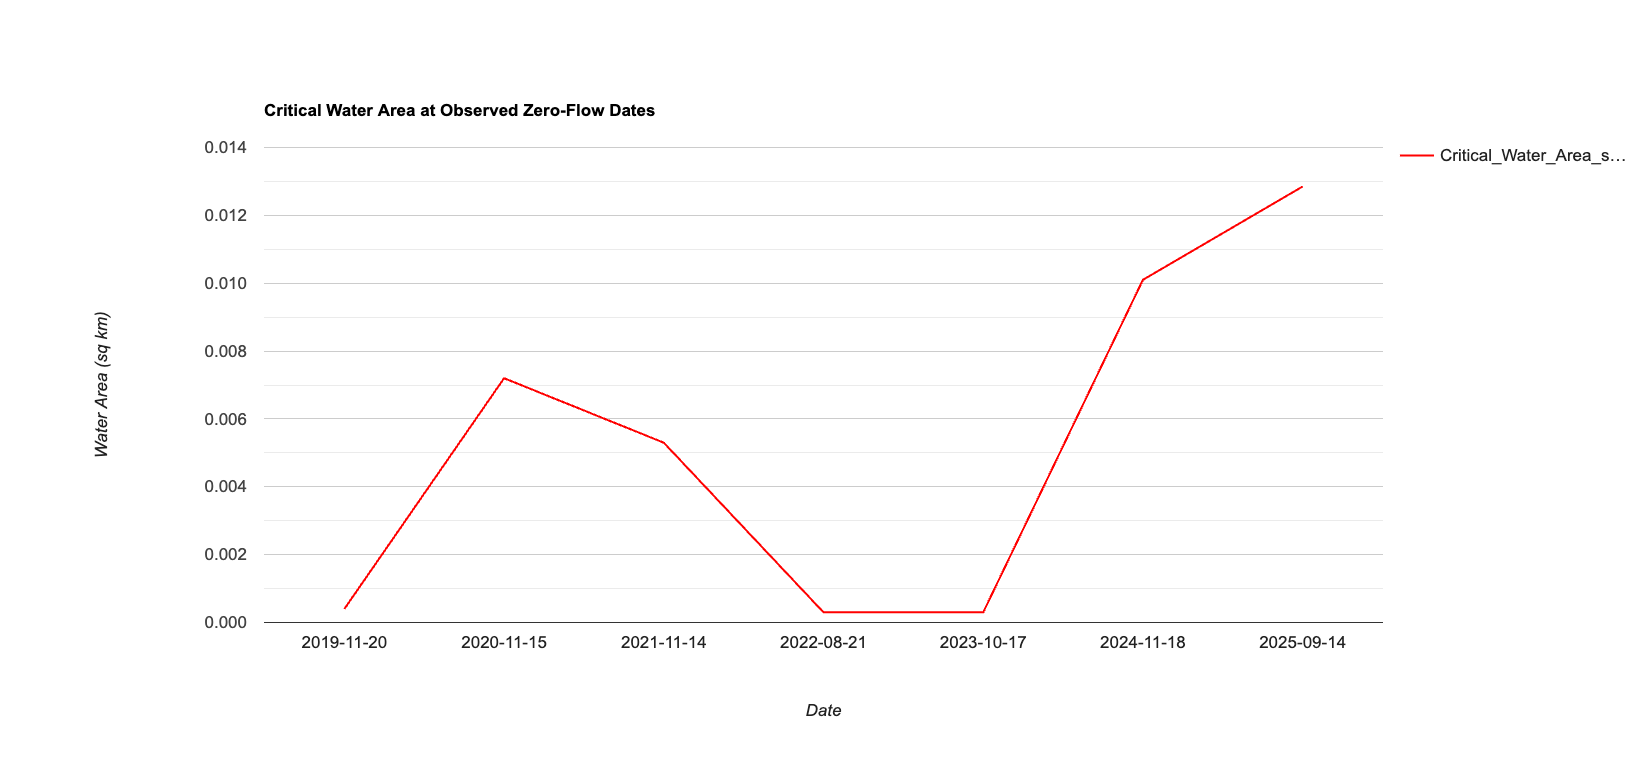
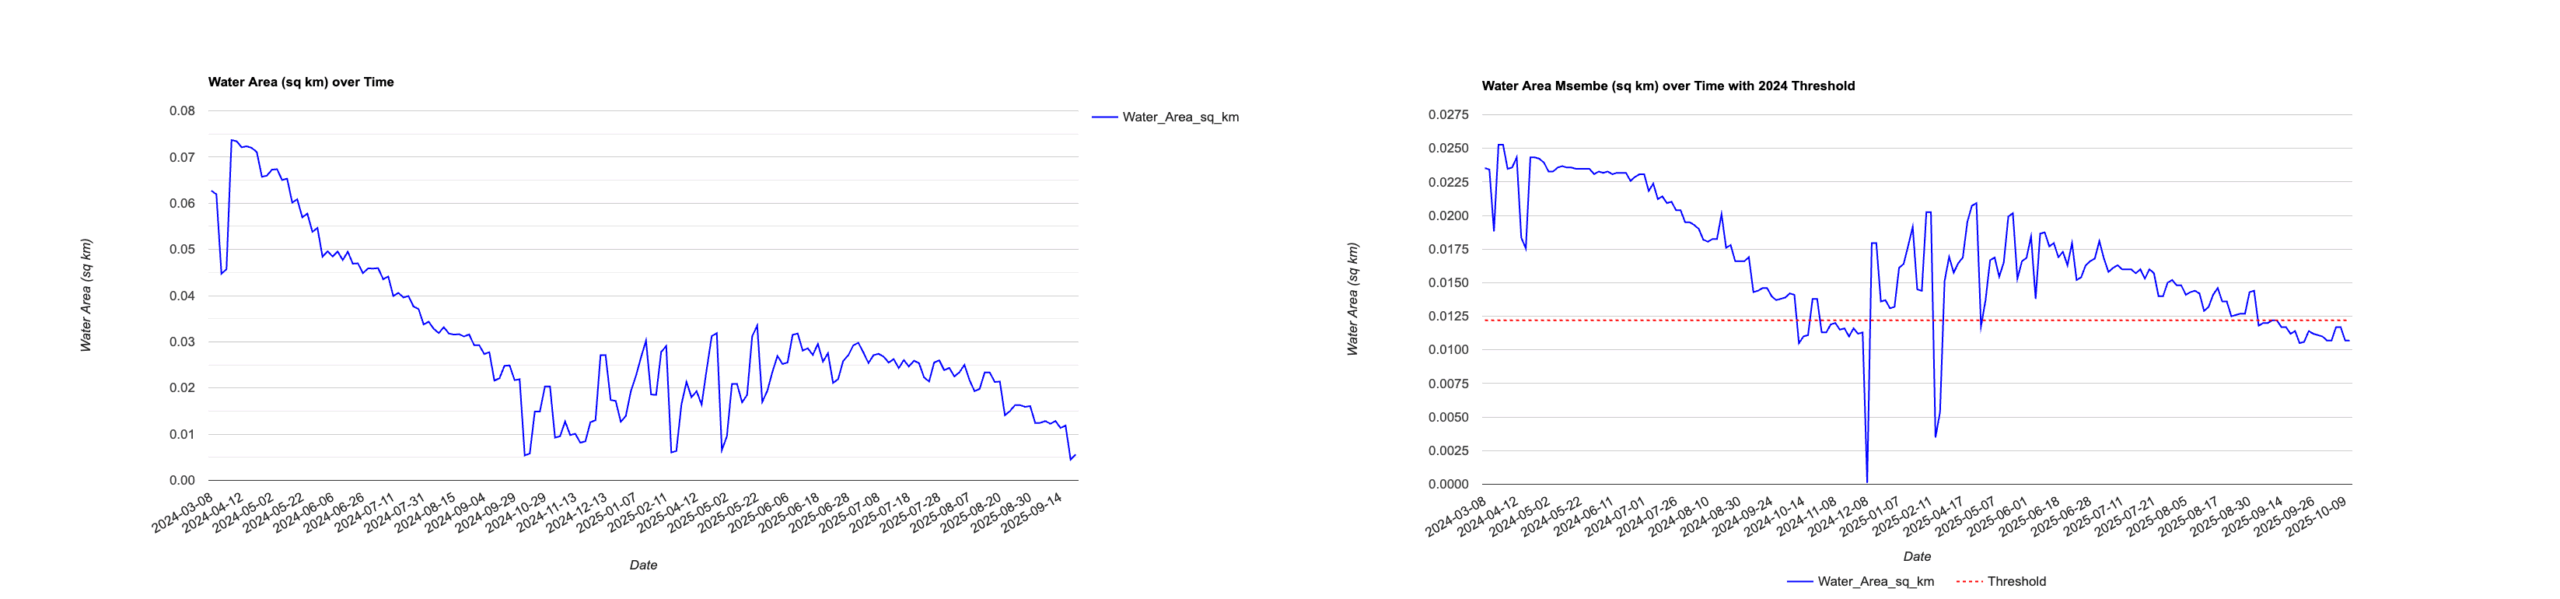
On 14 September 2025 zero flow has been computed from the critical water area 2km upstream of the msembe bridge. Over the years the fluctuation in the critical value will straighten out. The critical water area values for the upstream (2km) virtual drainage assessment station (VDAS) are listed in the table.
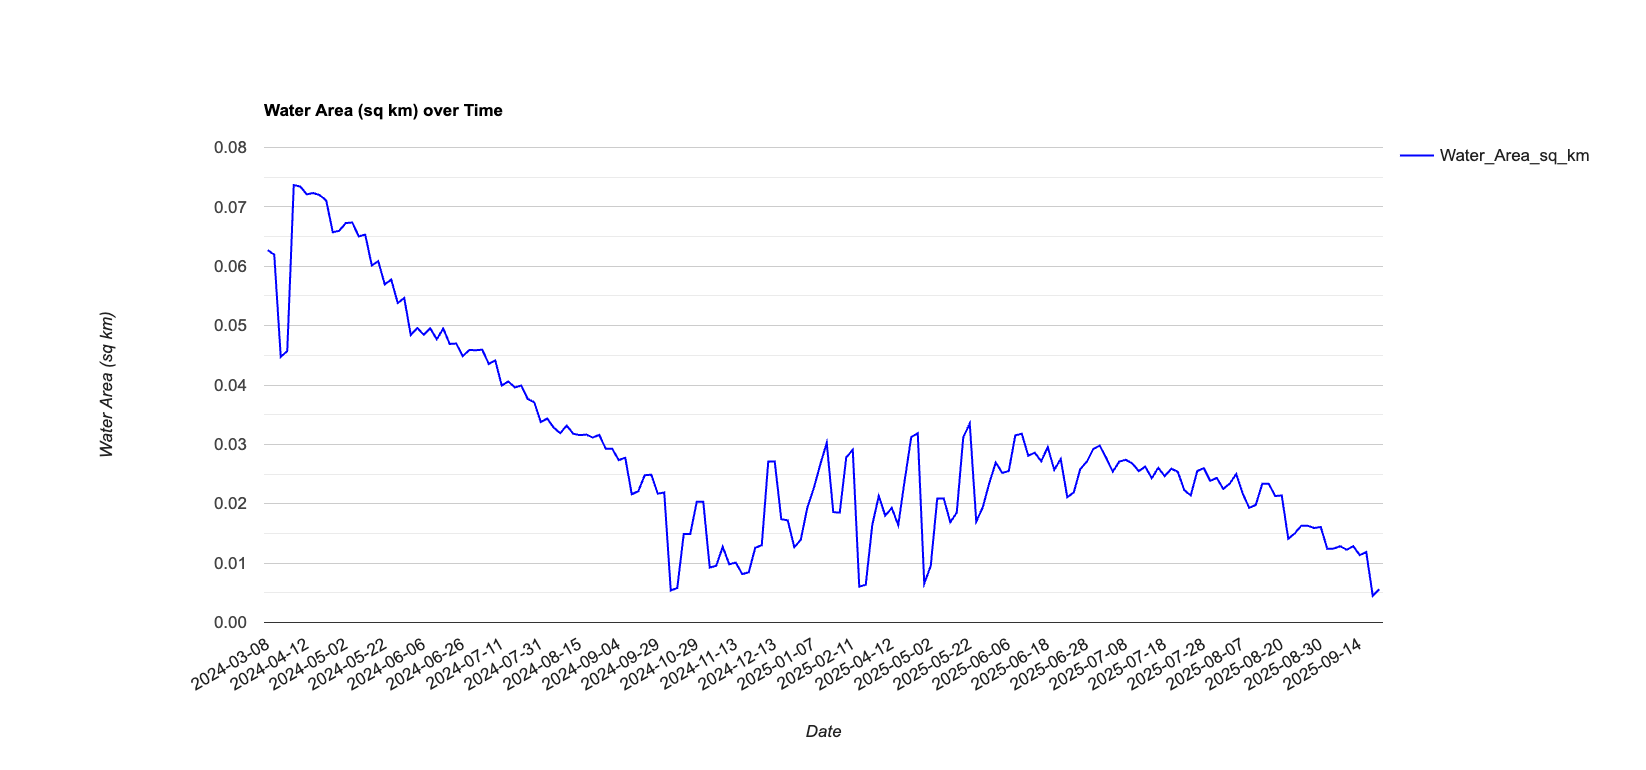
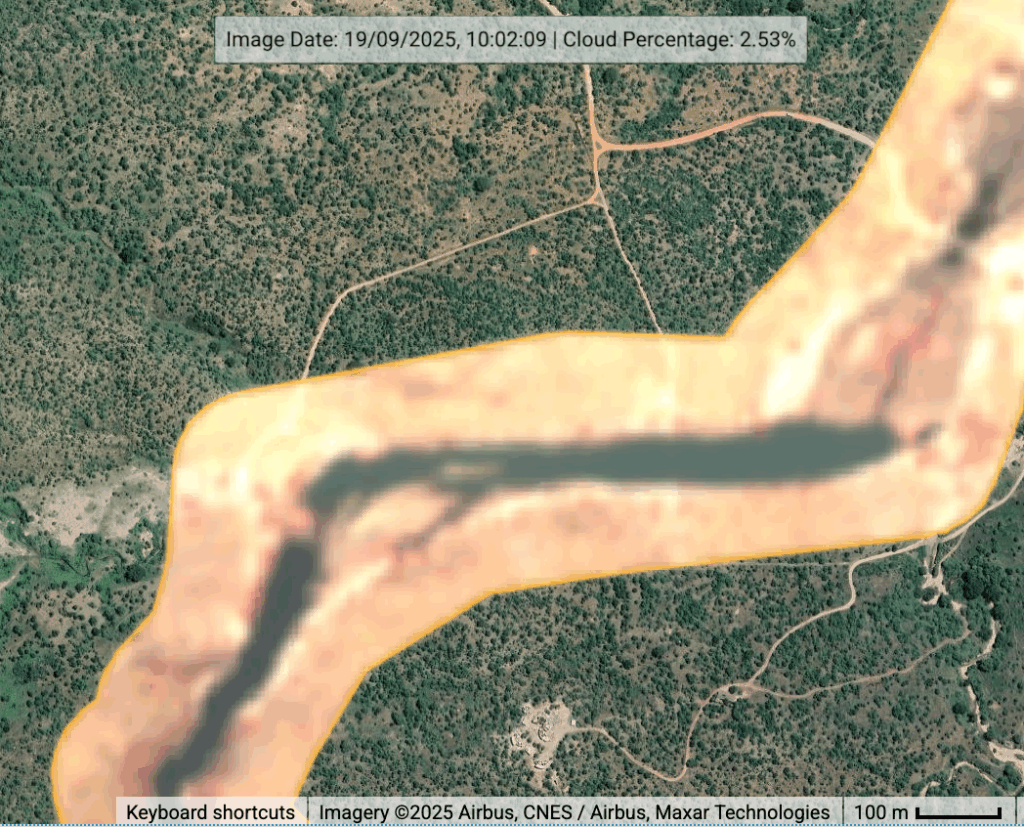
The animation clip illustrates the comparison of the water area (false color) at the msembe bridge on 2025-09-14 zero flow with the 2025-09-19 false color image. The high resolution critical water area polygon of 0.013sqkm at the bridge is based on the high resolution 2017-01-25 image. If the water area would not have dropped dramatically on 2025-09-19, 2km upstream of the msembe bridge, the latter date could also have qualified as zero flow event according to the visual inspection in the animation. Both critical values for the upstream Msembe VDAS and “hippo pool” Msembe Bridge VDAS, are by pure chance close to each other and both show a drop for the 2025-09-19 water area.
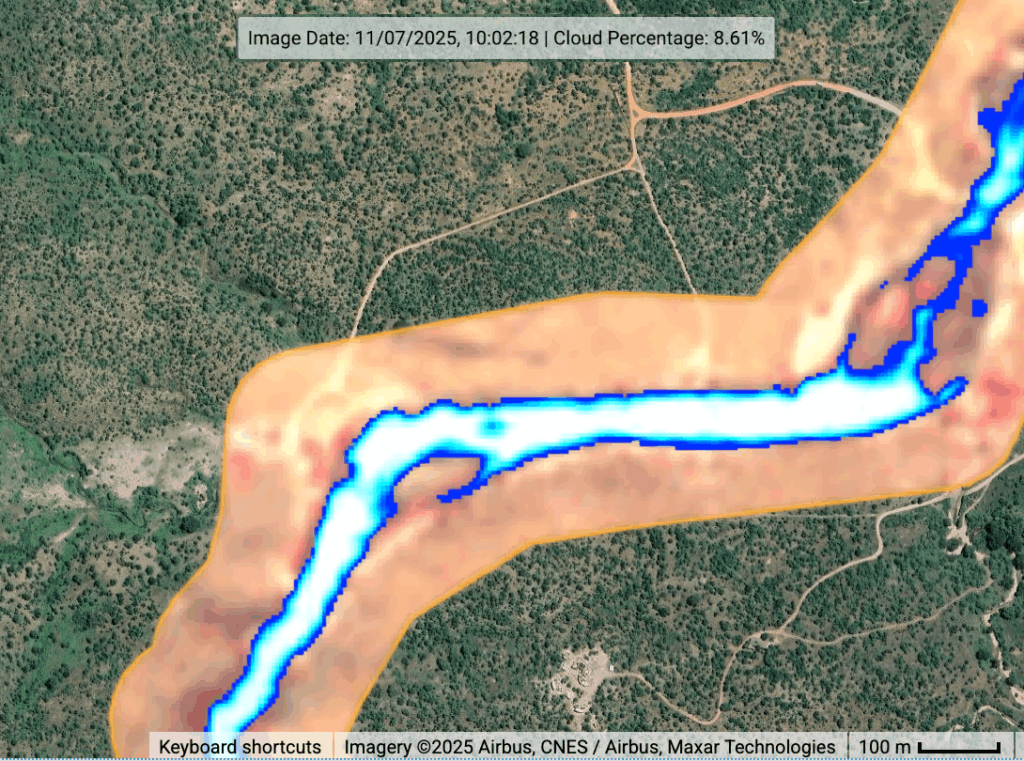
Flow at Ruaha Park HQ July 11, 2025
Compare decline Ruaha River at Park HQ one month later than previous image.
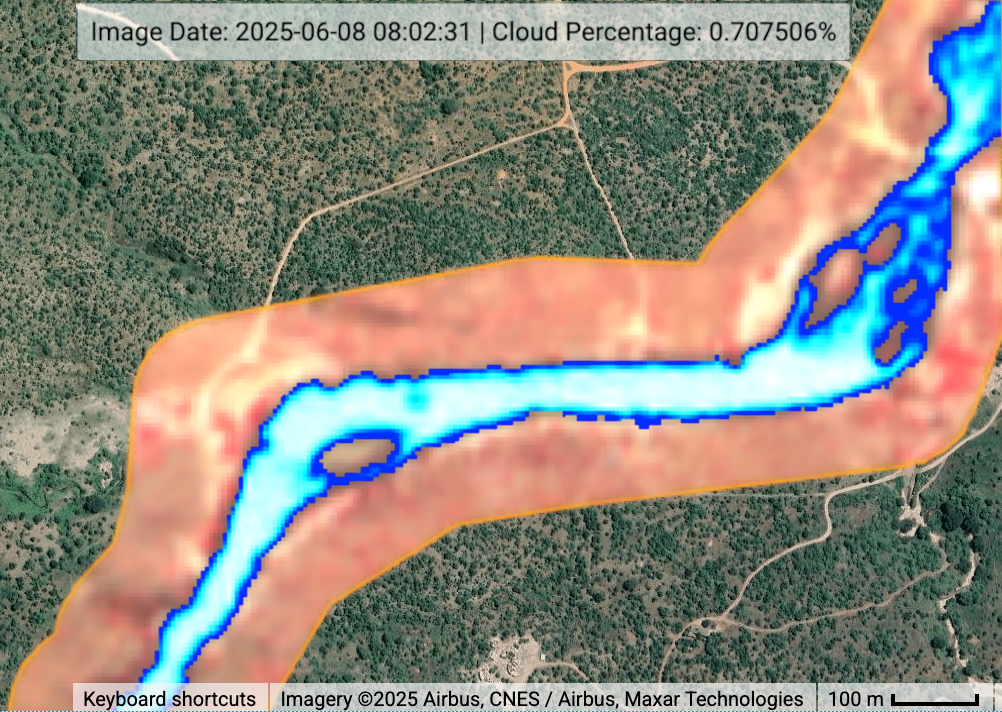
Flow at Ruaha Park HQ on June 8, 2025
For more details visit interactive GEE map on the front page of the Ruaha Flow Monitor. In the map you can remove layers and zoom in for details. The current google earth satellite image is dated March 16, 2024.