Subcatchment Condition comparison Ruaha and Mbarali
MENU
Update Upper Reaches Catchment Condition Ruaha and Mbarali Rivers
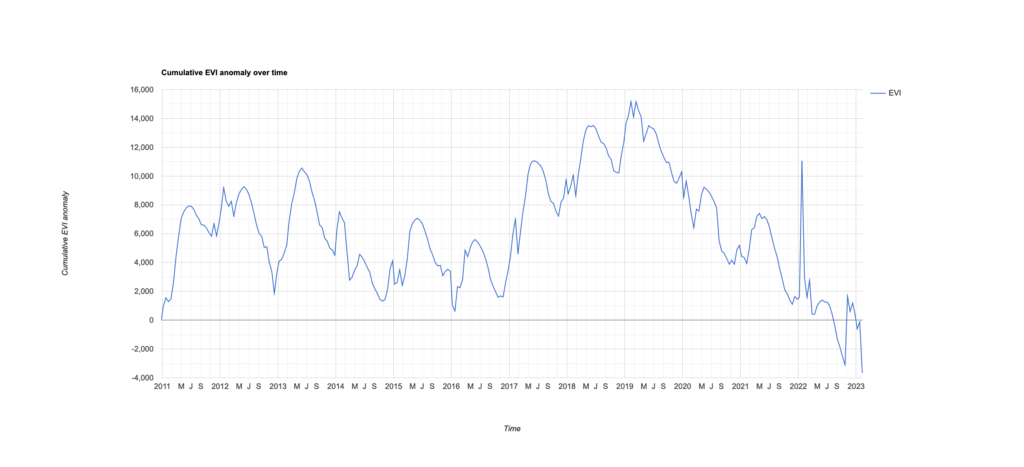
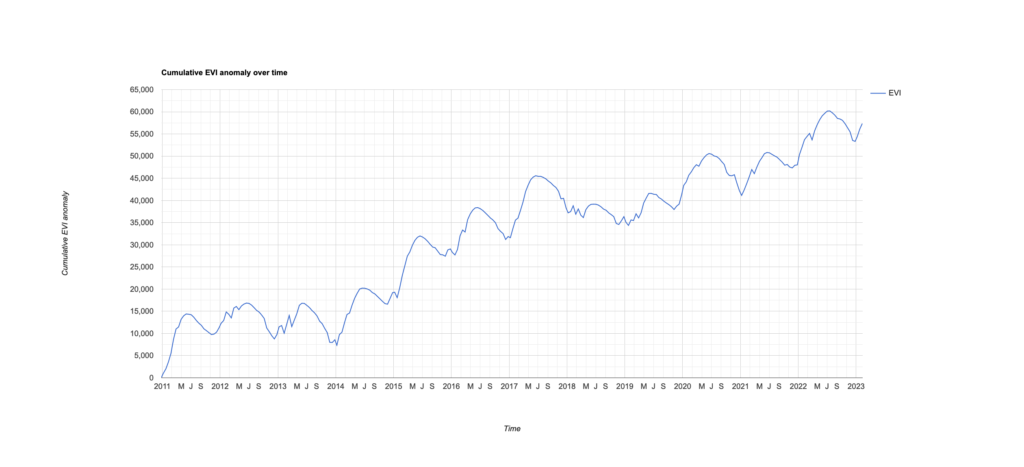
It is not all disaster and we keep on searching for good news! Not only for Maji Yetu but also for the struggle against climate change. The analysis below does find some support in the EVI anomaly for Mbarali and Ruaha upper catchments. EVI stands for enhanced vegetation index and relates to the recovery of the vegetation. As concluded and supported by the flow measures the Ruaha Catchment is doing well while Mbarali is getting worth. By monitoring the EVI for these areas developments can be detected remotely and adequate measures taken.
The background for the data can be found here. Please do not forget to refer to this page if used. The reference period for the EVI value for both catchments is ‘2002-07-30’ to ‘2010-12-31’.
Interestingly the overall absence of recovery at Mbarali changed in November 2016 when EVI started to improve until February 2019 after which a downward trend started. The corresponding tree cover loss graph in 2019 peak is not reflected by a similar dip for EVI but may have been the tipping point.
The EVI values are calculated for point values any update on actual catchment areas are welcome. Otherwise maji yetu will compare the difference soon.
(Click on Image to enlarge)
Published September 27, 2023
The research for the development of the flow monitor revealed that the decline of the low flow in the Mbarali river, one of the two rivers contributing to the low flow in the Ruaha National Park, is the main reason for the occurrence of zero flow at Park Headquarter. The trend of reducing minimum flow in the Mbarali ultimately resulted in returning periods of zero flow at the Park Headquarter in the 1980s. Up to that time irrigation was still insignificant and limited to an area of a hundreds of hectares.
It is claimed that even without the development of the Rice Irrigation especially in Ifushiro – Kapunga area, the Ruaha River would have ultimately dried at the Park Headquarter due to the decline of the minimum flow in the Mbarali dropping from more than 3 cumecs in the 1970s to the current 1 cumecs or less, as it reaches the Usangu Plain. This decline is related in the following analysis to the increased activities in the catchment.
Before the large scale irrigation development at Usangu, almost all water in the Ruaha River during the low flow period would evaporate on the Usangu Plain, in the extensive swamps (>5,000ha of swamp with minimum flows in Ruaha of 2 cumecs). These swamps have now been developed in the commercial and smallholder rice schemes of Kapunga and the informal rice irrigation development at Ifushiro. In other words at the time rice irrigation was not developed yet (before the 1980s) the low flow in the Ruaha River at the Park HQ depended fully on the Mbarali minimum flow and would have dried these days even without rice irrigation, considering a minimum flow of sometimes less than 1 cumecs flowing on to the Usangu Plain in the Mbarali. These low flow would have been inadequate to reach Msembe Bridge (Park HQ) through the Ihefu Swamp and 100km down the bridge. It is now the drainage from Rice Schemes along the Ruaha which keeps Ruaha flow at the Park HQ while all low flow in the Mbarali River ( < ~2 cumecs) is diverted from the river at the New NAFCO Headworks at Mbarali and only some return flow back to the main channel of the Mbarali will reach the confluence with the Ruaha and ultimately the Park HQ.
Both the further drop of the Mbarali low flow and the uncontrolled use of the limited water in the Ruaha and Mbarali Rivers and spill during the low flow period have aggrevated the situation ever since. Due to the limited water only few rice farmers will benefit from this practice but with major impact on the flow of water in the National Park downstream.
While the flow reduction since the 1970s at Igawa (Mbarali River) is evident, the Ruaha Low Flow is surprisingly constant over the same period.
Rainfall data (IMERG)20 show no significant difference between 2001 and 2021 for the two subcatchments. More recent precipitation data39 suggest an annual difference of more than 200mm with 1453mm/yr in the upper catchment of the Ruaha River (Salimwani) as compared to the Upper Mbarali River (Igawa) with 1220mm/yr.
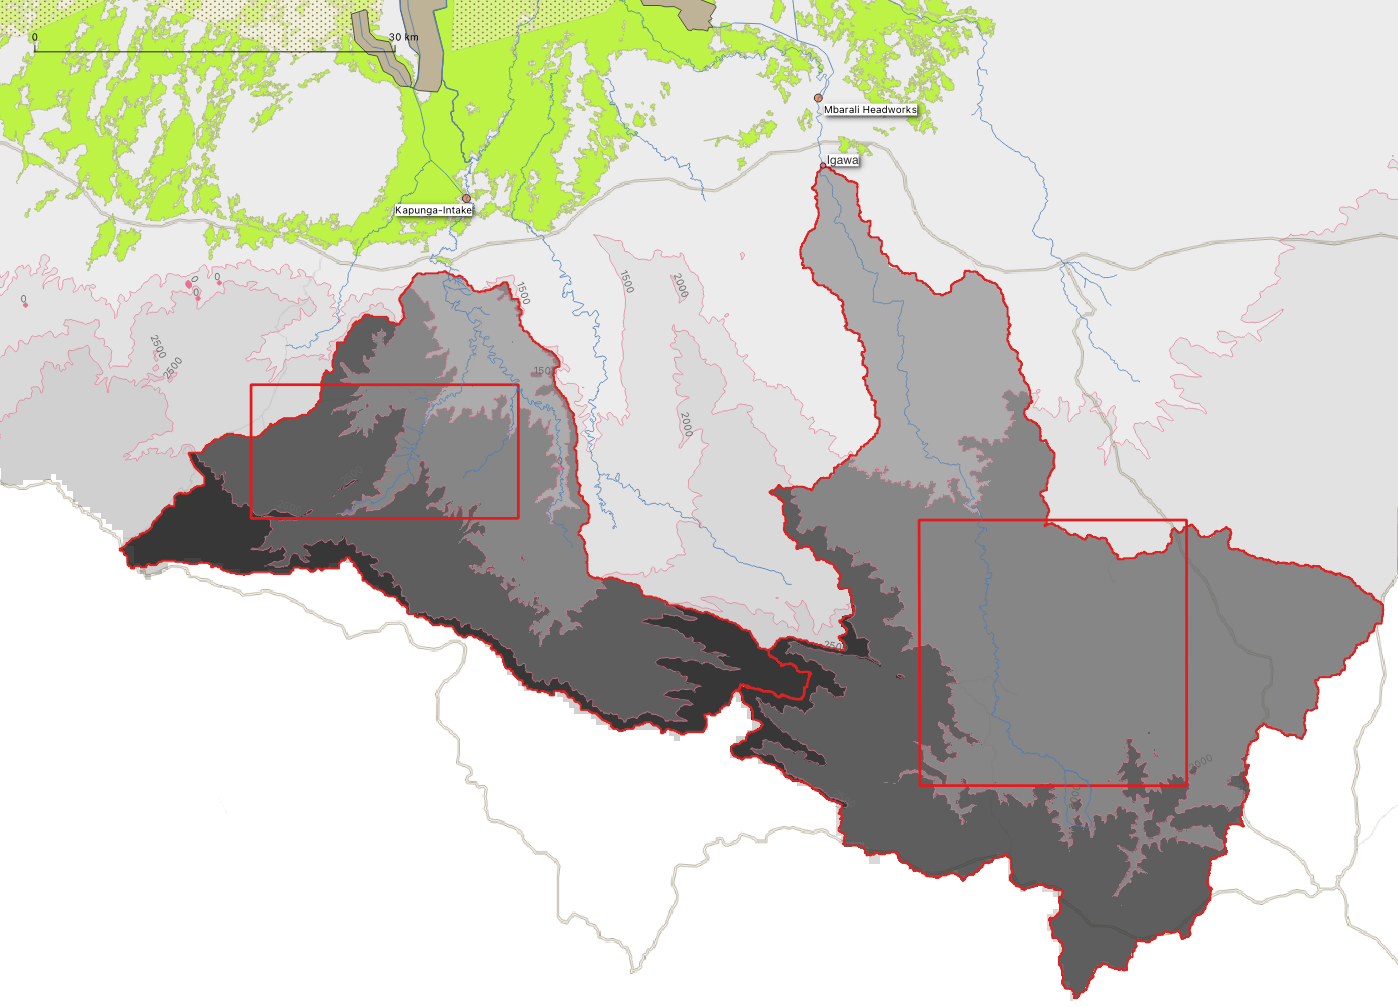
The image below locates the bounding boxes for both subcatchments used to assess monthly totals for the rainy season period from November to March. The total merged satellite-gauge rainfall for this period provides a reasonable prediction for the occurrence of zero flow in the Ruaha River at Mtera and related Alert Phases.
As the rainfall differences do not seem to explain the dropping low flow in the Mbarali since the 1970s, catchment related human activities become the next focus.
Human related activities resulting in Tree Loss in both catchments and other drainage related interventions are expected to cause the long term drop of minimum flows in the Mbarali. This hypothesis should be supported by data of much less human interference in the integrity of the Ruaha (Salimwani) catchment while the Ruaha catchment has a more or less stable minimum drainage flow since the 1970s of around 2cumecs. A comparison of key interventions for both catchments is attempted below.
Land use trends in the Mbarali Catchment possibly related to the decline of the minimum flow in the Mbarali River are revealed in a study21 which comes to the following key data.
| Table 1: Values of some Key Catchment variables Mabarali Catchment study 2018 | |||
| 1990 | 2006 | 2017 | |
| runoff (yield) | +4.14mm(-0,07mm) | +5,29 mm(-0.93mm) | |
| ∆ mean monthly flow dry season from 1990 | -0.21 m3/s | ||
| groundwater contribution | -6.3% | -12.86% | |
| Forest | 7.54% | 5,51% | 5.23% |
| cultivated land | 25.69% | 31.53% | 43.57% |
| Built-up Area | 0.03% | 0.34% | 0.36% |
Increased runoff, reduced groundwater contribution to flow, decreased forest cover and increase of cultivated land, may contribute to flash floods in the rainy season with declining base flow in the dry season.
Unfortunately a comparable study for the Salimwani Subcatchment of the Ruaha River, has not yet been found.
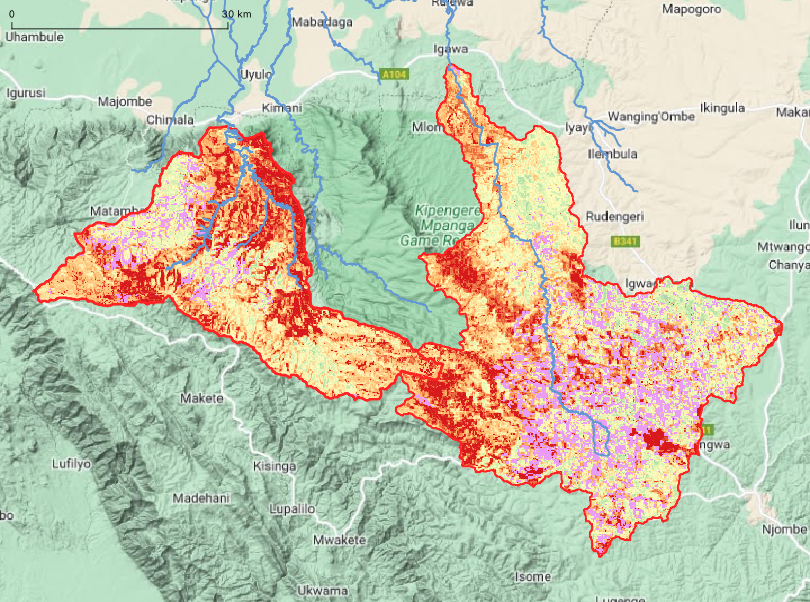
Alternatively, a global crop cover raster from the Copernicus Land Services with 100m resolution land use maps22 is used to compare the 2017 Land Use for both subcatchments.
The replacement of natural vegetation by crops has visibly, much more advanced in the Mbarali Catchment. The purple patches represent crops in 2017. Left is the red bordered Ruaha Subcatchment with pour point at Salimwani at the top of the catchment where the Ruaha flows on the Usangu Rice Plain. Right is the larger Mbarali Catchment draining at Igawa.
| Table 2: Crops in 2017 from global 100m pixel data for both catchments (compare mbarali study Table 1.) |
||
| Ruaha (Salimwani) | Mbarali (Igawa) | |
| Crop Area | 55.8 sqkm (6.6%) | 276.1 sqkm (16.4%) |
| “Cropland” Table 4 code 4023 (Copernicus global 100m/px) | 37.73% | 53.99% |
The differences between the “crops area” derived from the global raster map and the “Cropland”23 land use category from the Copernicus services is demonstrated by the different extend of the purple in the “crop cover” geometry above and the “cropland” also purple in the land use map below for both subcatchments (Ruaha (Salimwani) and Mbarali (Igawa). The Land Use category Cropland is several times larger than the crop area in 2017 for both subcatchments.

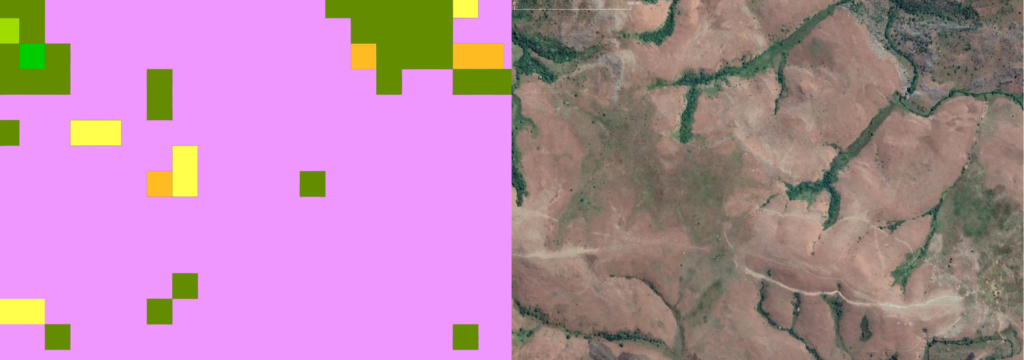
The “Crop Cover” estimate is considered more accurate while it is based on reflection of actual crops grown during the year considered. The “Cropland” category from the global 100m/px crop raster file includes unavoidable local errors. Not only land cultivated in previous years but also areas without traces of ongoing or former cultivation seem to be included under “Cropland”. The image below, in the Ruaha upper reaches of the catchment illustrates that even natural grassland can be included in the land use category “cropland”. The origin of the image detail of the Ruaha Catchment, is indicated by a black window near the center of the image above.
The Loss of Tree Cover in the Mbarali Catchment (Igawa) with a total area of 1,627 km2 is estimated by the Global Forest Watch platform on the basis of the approach proposed by Hansen et al. 2013. Reference24. Tree planting and participatory forest management are among the opportunities of the Ministry of Natural Resources and Tourism and may in the long run tip the balance of declining low flow to annual increase in minimum drainage, if managed well.
According to the data starting from the year 2000 Tree Cover with density of more than 30% is lost in both subcatchments of Ruaha (Salimwani) and Mbarali (Igawa). In line with the conclusions above loss of Tree cover is expected to be larger in Mbarali Catchment both in terms of absolute loss and relative to the total catchment area. The Mbarali Subcatchment is almost twice as large as the Ruaha Subcatchment (1,552 km2).
Table 3 and Table 4 list Tree Cover losses in 2001 to 2021.
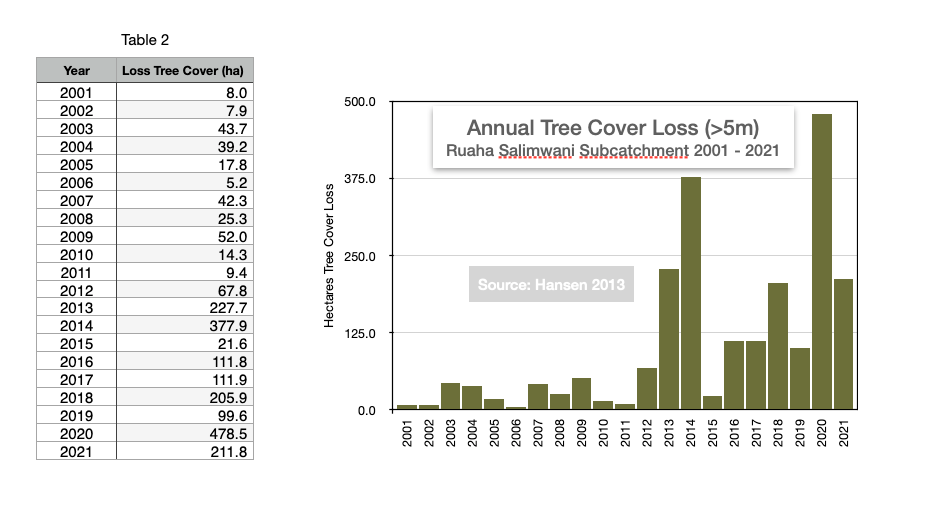
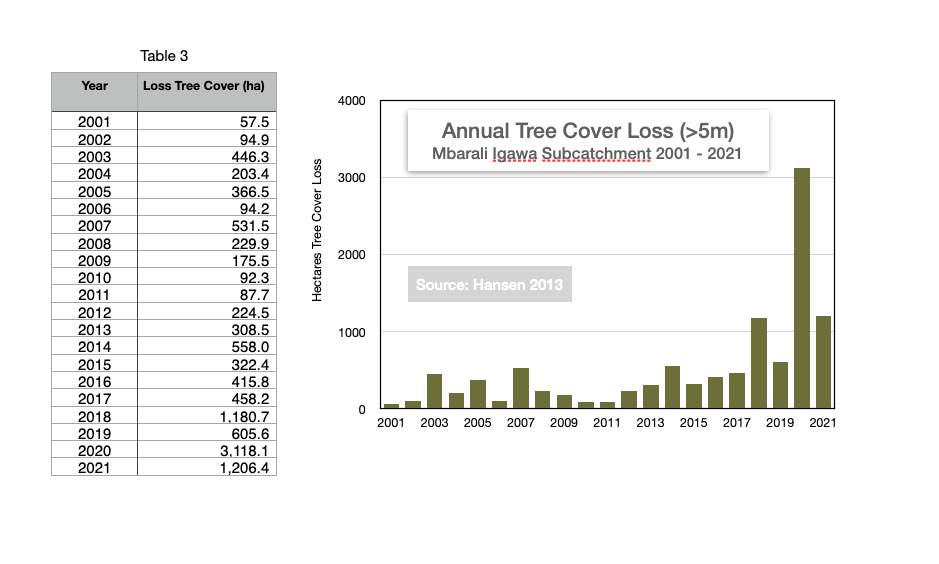
Unfortunately the gain of Tree Cover is only monitored for the period 2000 to 2012 (Hansen 2013). As a result the Tree Cover (density > 30%) in Mbarali Catchment has a negative value of -2,702.5 ha while new plantations have not been included in the balance. The negative value for loss of Tree Cover is based on the Hansen et al. data with 8,075ha of Tree Cover in 2000 and loss of 10,778 ha during the period 2000 to 2021. Apparently wood lots have been planted and harvested during the 20 years period between 2001 and 2021 explaining the fact that there was more loss during the last 20 years than there was tree cover in 2000.
Both images below with a detail of the Mbarali Subcatchment show left the geometry of the tree cover (density >30%) in 2000 for the Mbarali Igawa Subcatchment and on the left random colors are used for each year loss of tree cover from 2001 to 2021. The losses in year 2020 which has a blue color show the extraordinary harvest that year as in table 4 above.

Not only the low flow measurements in the Mbarali River at Igawa will be most relevant to monitor for assessment of the condition of the Igawa Subcatchment, also the annual crop cover developments in Ruaha Salimwani and Mbarali Igawa subcatcments and Hansen Tree Cover Losses wil be monitored in support of possible improvement measures by the Ministry of Natural Resources in the catchment rehabilitation. As discussed on a different page extra efforts by the Ministry of Water to obtain more accurate low flow data of the five important gauge stations will be required for conclusive relations between low flow – zero flow and monitoring of the condition of both subcatchments.