MENU
The newest post and image entries are on top of the page. Scroll from the bottom upwards to follow the flow status timeline of the Ruaha River per location
Last Updated 9 hours ago
Return of Flow (ROF) not expected soon
Following the machine-detected zero-flow date at ParkHQ/Msembe on 29 September 2026—with 4 October retained as a later confirmation checkpoint—we are preparing two independent rainfall-based forecasts for the river’s return of flow.
One forecast uses NASA IMERG rainfall and the other uses JAXA GSMaP rainfall. Both assess observed rain after zero flow, with the Msembe/ParkHQ catchment as the principal forecast area. Rainfall over the upstream Great Ruaha, Usangu and Salimwani areas provides supporting context. Cumulative rainfall and recent rainfall totals—particularly over 7, 14 and 30 days—are compared with historical ZFO-to-ROF seasons at the same stage after zero flow.
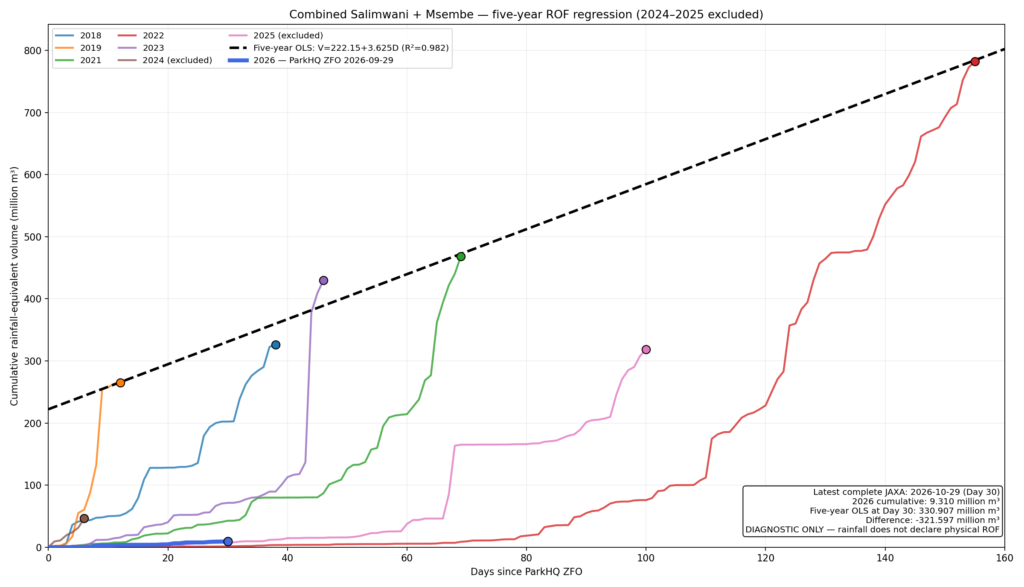
As is illustrated by the realtime monitor comparing historic rain accumulation trajectories and the current accummulated rains (2026) return of flow is not expected soon.
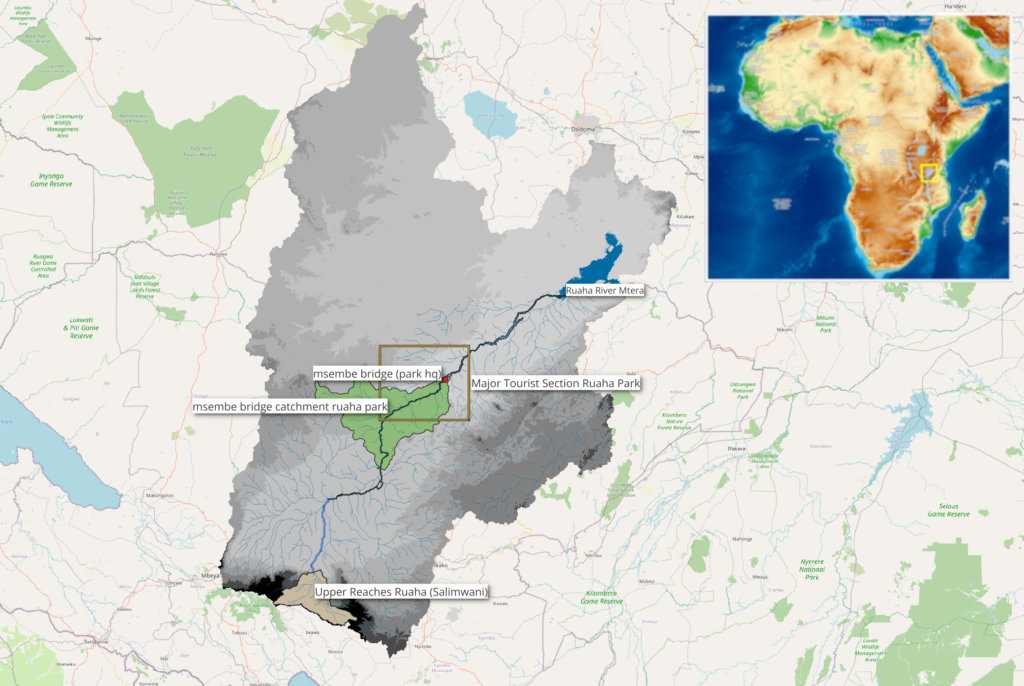
The first image below locates the catchments used for the combined satellite rain data (JAXA GSMap) and the historical ROF dates after machine confirmed zero flow at the park hq (Msembe Bridge).
JAXA GSMaP rainfall monitor after ParkHQ zero flow. The blue line represents complete daily rainfall from 30 September through 29 October 2026, converted to rainfall-equivalent volume over the Msembe and Salimwani catchments. The cumulative value reached 9.310 million m³ by Day 30. The dashed line is a diagnostic regression through five historical ROF endpoints: \(V=222.154+3.625097D\), \(R^2=0.982\). Its Day-30 reference is 330.907 million m³. The 2026 accumulation was therefore 321.597 million m³ below that historical reference. This comparison does not declare, rule out, or predict physical return of flow. It does relate the current zero flow period of the Ruaha River to previous years and the length of these historic zero flow periods defined by the time span between the start of the accummulated rain curves and the ROF date. The BLUE LINE represents the current rains since September 29, 2026.