MENU
The newest post and image entries are on top of the page. Scroll from the bottom upwards to follow the flow status timeline of the Ruaha River per location
Last Updated 6 days ago
Hindcast assessment Alert 1 Ruaha River section Zero Flow
Between September 4 and 9, 2026 the surface water flow is expected to have ceased. Machine confirmation will be tested soon.
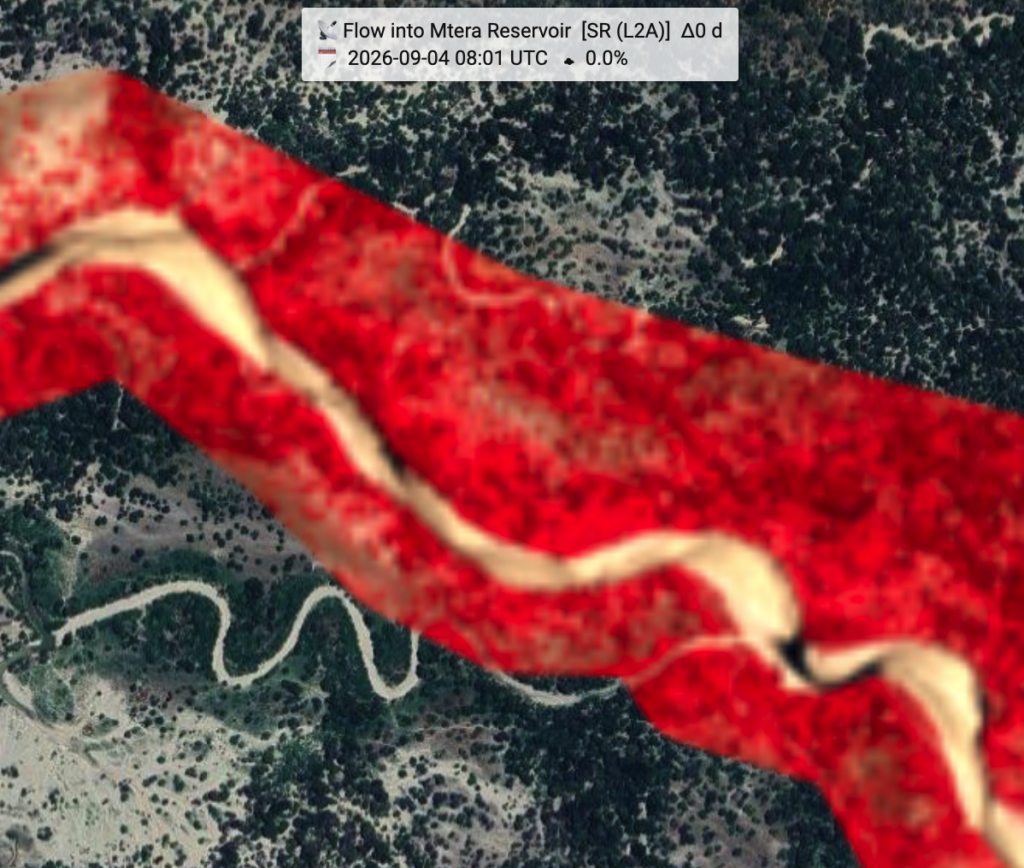
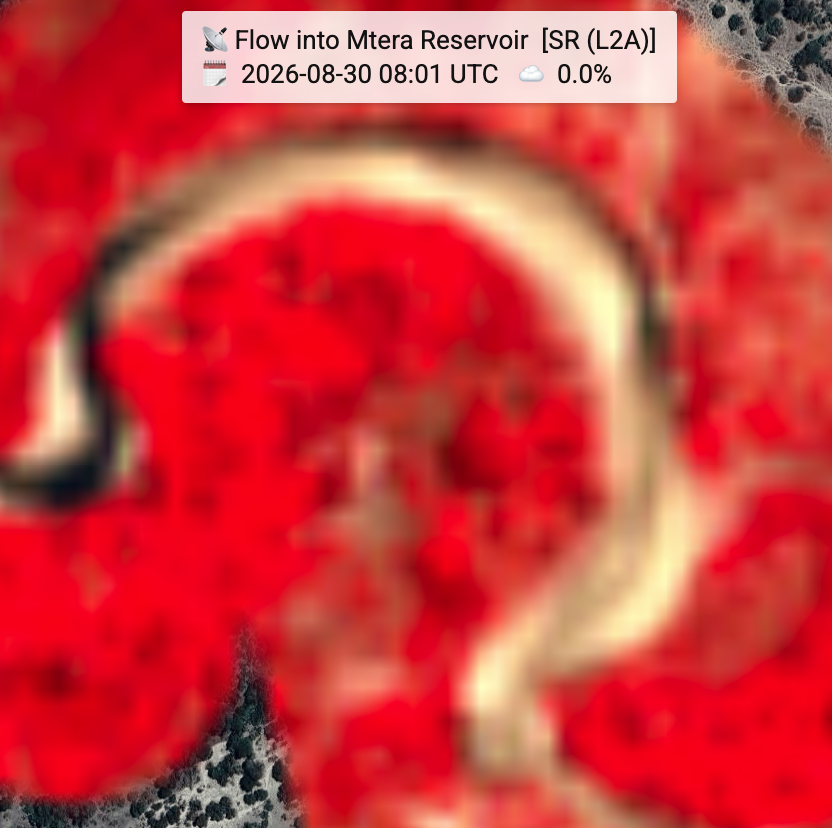
A2 zero flow August 30, 2026, confirmed
The suspected arrival of zero flow on August 30, 2026 has now been confirmed by the September 4, 2026 sentinel2 false color image. The conclusion is made by an semi-automated analysis of the 5m resampled image of the river section which in the past showed the earliest signs of zero flow at the Mtera Reservoir more than 100km downstream of the Ruaha National Park.
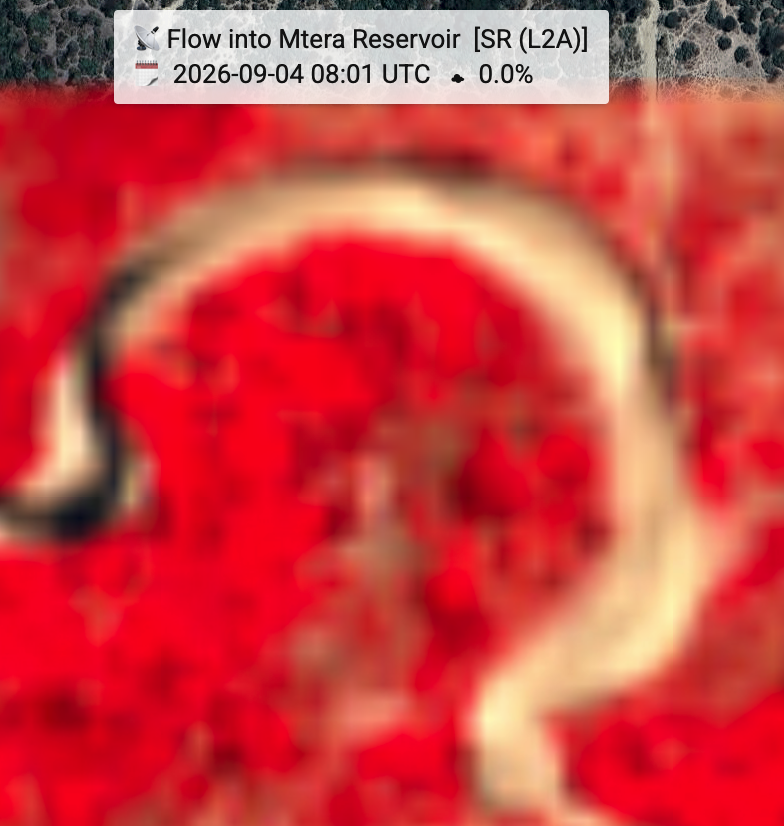
A2 zero flow detected on August 30, 2026 – to be confirmed
As soon as confirmed by the upcoming sentinel-2 image expected September 4, 2026, August 30 2026 will be reported as the ALERT 2 date for 2026.
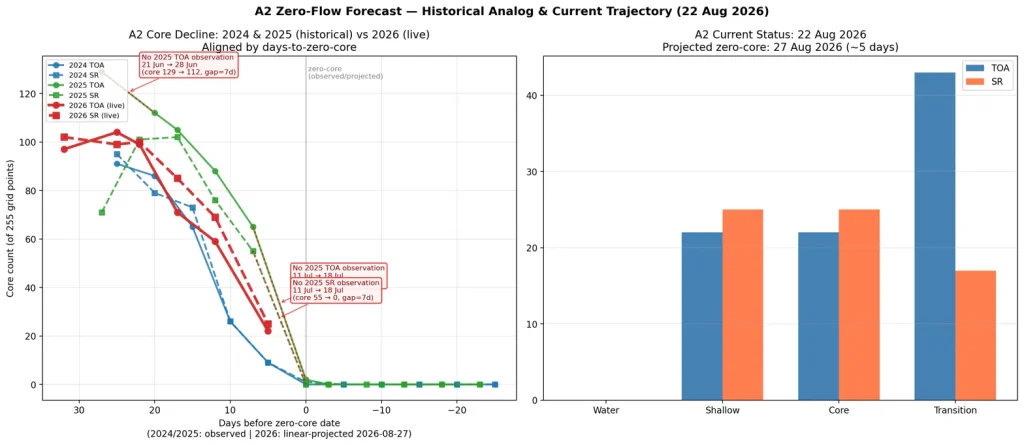
A2 Satellite Indicator — Critical Low-Flow Update, 22 August 2026
Satellite observations show a continuing and rapid decline of the remaining wetted core at the A2 monitoring site, approximately 100+ km upstream of Msembe Bridge.
On 22 August, the two independently processed Sentinel-2 products showed only 22 TOA and 25 SR core points remaining on the fixed 255-point monitoring grid, with no points classified as open water. Based on the recent rate of decline, both products project the A2 core population to approach zero around 27 August 2026. This projection is provisional and will be updated following the next suitable satellite observation.
The historical comparison indicates that the present decline is consistent with the late stages of previous low-flow seasons. The 2024 series provides the clearer comparison. The 2025 record contains a seven-day observation gap precisely during the critical final decline, so it cannot provide a like-for-like estimate for the present 22–25-core state.
Operational interpretation: A2 provides an upstream early-warning indicator that can support timely abstraction-management decisions along the Ruaha and Mbarali Rivers. A projected zero-core condition at A2 does not mean that Zero Flow has occurred at Msembe Bridge. Msembe Zero Flow requires separate field confirmation.
The next update will incorporate new satellite observations as they become available.
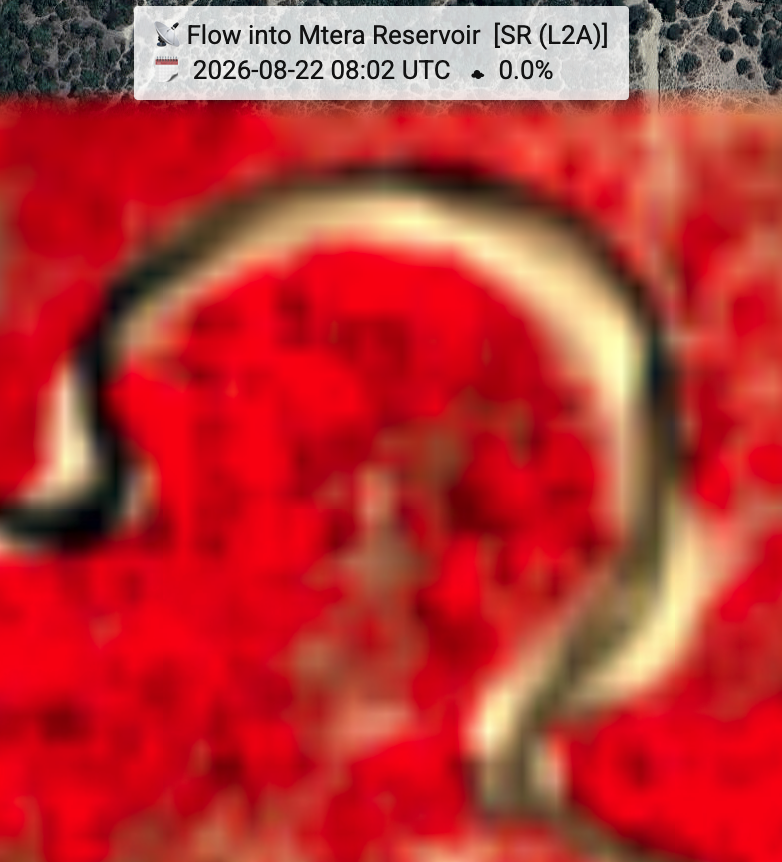
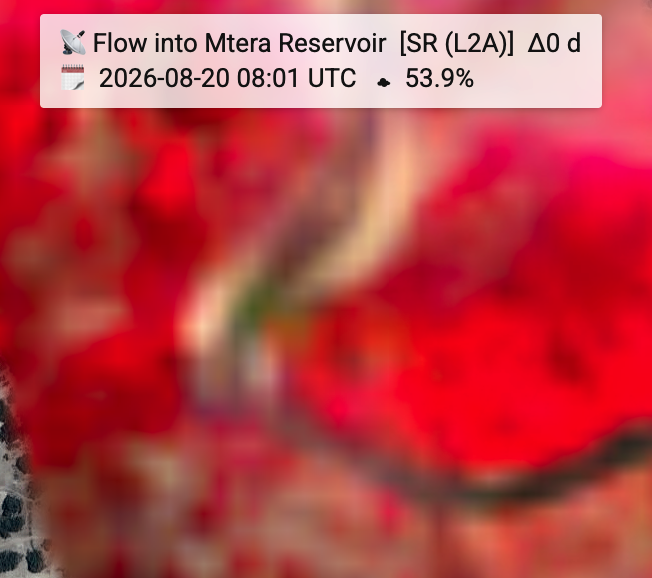
SUSPECT Zero Flow Alert2 Ruaha River At Mtera
The 60% cloudiness image of Today (August 20, 2026) is a suspect computed (joint spectral population) zero flow image. The blueish coloring could relate to smoke from bush fire in the area and its impact on the calculated band 8, 4 and 3 false color values can result in prematurely recorded A2 zero flow. The upcoming sentinel-2 image and further investigation of the August 20 image solidify the zero flow detection.
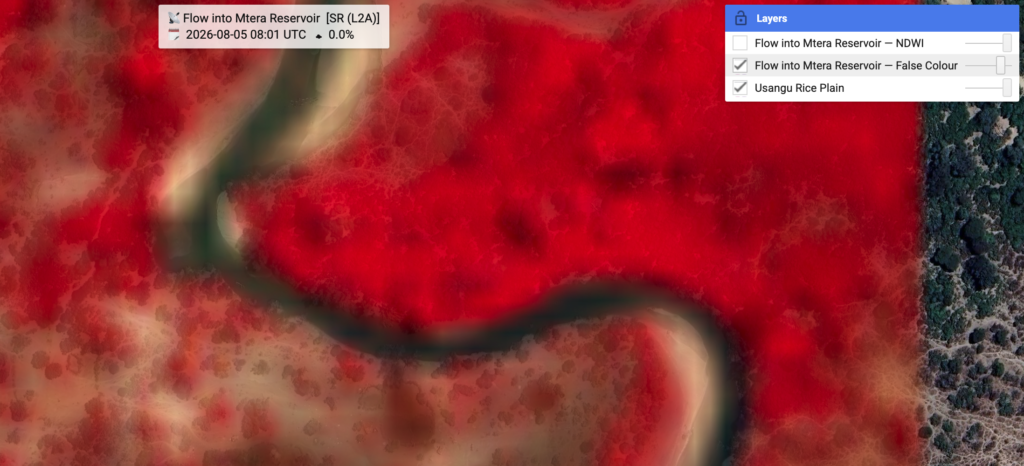
On August 5, 2026 and estimated 1-2 weeks for Alert2
To investigate the interpretation of the 5m resampled Sentinel-2 SR image try to apply the example in second image to manipulate the interactive gee-map above.